Created Wetlands In Northern
Arizona
Design & Layout
Size of Wetlands
|
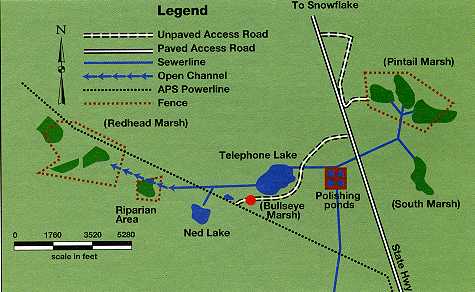
Telephone Lake
Pintail Lake
South Marsh
Redhead Marsh
Bullseye Marsh
Ned Lake
Riparian Area |
45 acres
57 acres
19 acres
49 acres
1
acre
15 acres
15 acres |
Total Acres=201 acres |
Since the
construction of the first wetland at Pintail Lake in 1978, there has been a
gradual evolution of the wetlands. In 1985 a major expansion occurred with the
construction of 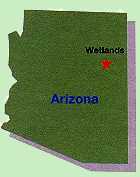 Redhead Marsh.This surge of construction was required as
effluent volumes produced began exceeding treatment and disposal capacities.
The present system is designed to handle 1.42 million gallons of wastewater per
day to serve a population of 13,500. Redhead Marsh.This surge of construction was required as
effluent volumes produced began exceeding treatment and disposal capacities.
The present system is designed to handle 1.42 million gallons of wastewater per
day to serve a population of 13,500.
The system was
designed to integrate several lakes and marshes into an effective wetlands
complex. Flexibility in management options was built in to accommodate changes
from year to year. The water delivery system was designed to provide additional
treatment before the effluent reaches Redhead Marsh.
Operation & Monitoring
The main
techniques used in operating the wetland complex involve the management of the
water. The quantity, quality, and delivery routes are varied to manage the
wetland habitat. The flexibility designed into the system allows a variety of
management options. For example, water control structures with adjustable water
boards are used to hold water levels at desired levels. Water can be diverted
away from some ponds to allow them to dry up. This is desired to allow for
maintenance and to accomplish vegetation management goals.
Monitoring of the
wetlands is conducted in accordance with the requirements of the Arizona
Department of Environmental Quality by the City of Show Low. Additional
monitoring is conducted by the Arizona Game and Fish Department and the U.S.
Forest Service.
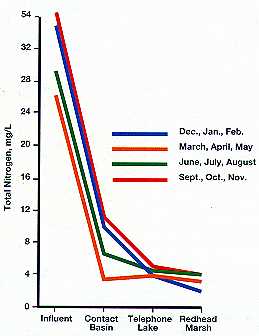
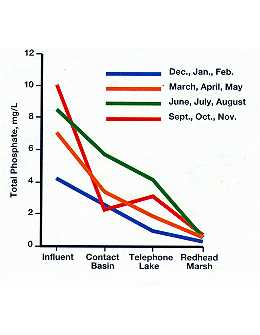
As water
progresses through the system, water quality improves. For example, secondary
effluent coming from the polishing ponds flows into Telephone Lake, then into
an open channel which delivers it to the riparian area. After the riparian
area, the water flows into another open channel and is finally delivered to
pond one of the Redhead Marsh. During this delivery process the water quality
greatly improves. The following charts show the removal rates for nitrogen and
phosphorus as water moves through the system.
For more information, please feel free
to contact the USDA Forest Service, Lakeside Ranger District at 520.368.5111 or
you may write us at 2022 W. White Mtn. Blvd., Pinetop-Lakeside, Arizona
85935
White Mountains Online wishes to express
our appreciation to the USDA Forest Service, Lakeside District for providing
this information! This and other articles may be found in print media entitled:
Constructed Wetlands for Wastewater
Treatment and Wildlife Habitat
United States Environmental Protection
Agency
#EPA832-R-93-005
September 1993
Continue to: Response, Operation &
Monitoring
|